You can view a dashboard if you have the proper permissions. The default location dashboards is the /Dashboards folder of your private organizational folder tree in the Repository. You can also open Out-of-the-Box Dashboards included with Lambda Zoola™ through the Publicfolder tree.
To open an existing Dashboard, complete the following steps:
- Open either the Library or the Repository
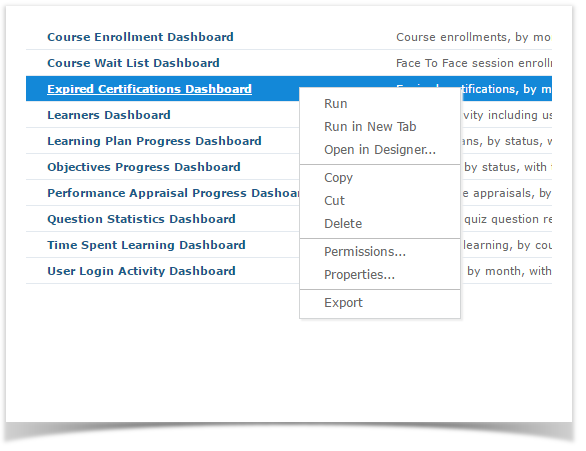
- Identify the Dashboard you wish to open to launch the Designer
- Right-click the Dashboard and select Open in Designer from the context menu. This option will only appear if you have the correct permissions to edit Dashboards.
Keep these points in mind when viewing a dashboard that has input controls:
An input control may appear as a text field, a drop-down, a check box, a multi-select list box, or a calendar icon.
If one of the frames in a dashboard does not refer to an input control, that frame does not update when you change that input control's value. Only reports that refer to the input control reflect the change.