This section describes the creation of a simple dashboard.
To create a simple dashboard, complete the following steps:
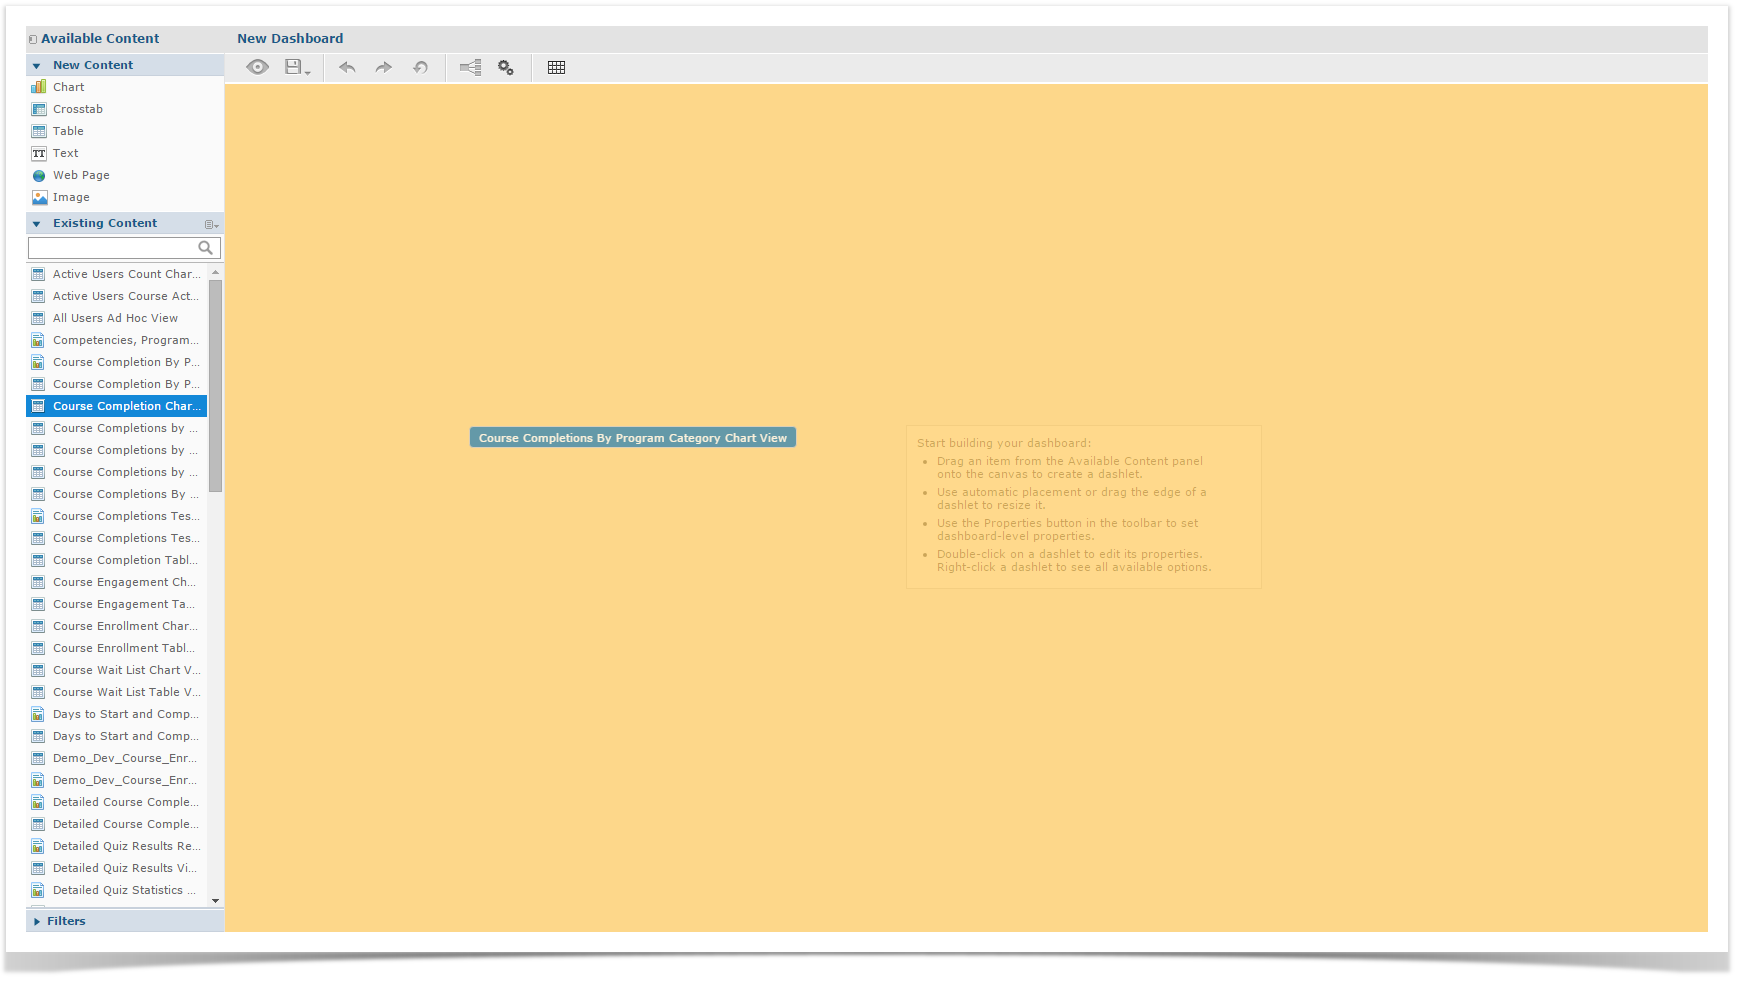
Click Create > Dashboard. The Dashboard Designer appears, displaying the list of available content and the canvas.
In the Existing Content section of the Available Content panel, select a Report.
Click and drag the Report onto the Dashboard Canvas.
In Available Content, select another Report.
Click and drag the report onto the canvas, until the left half of the report turns orange.
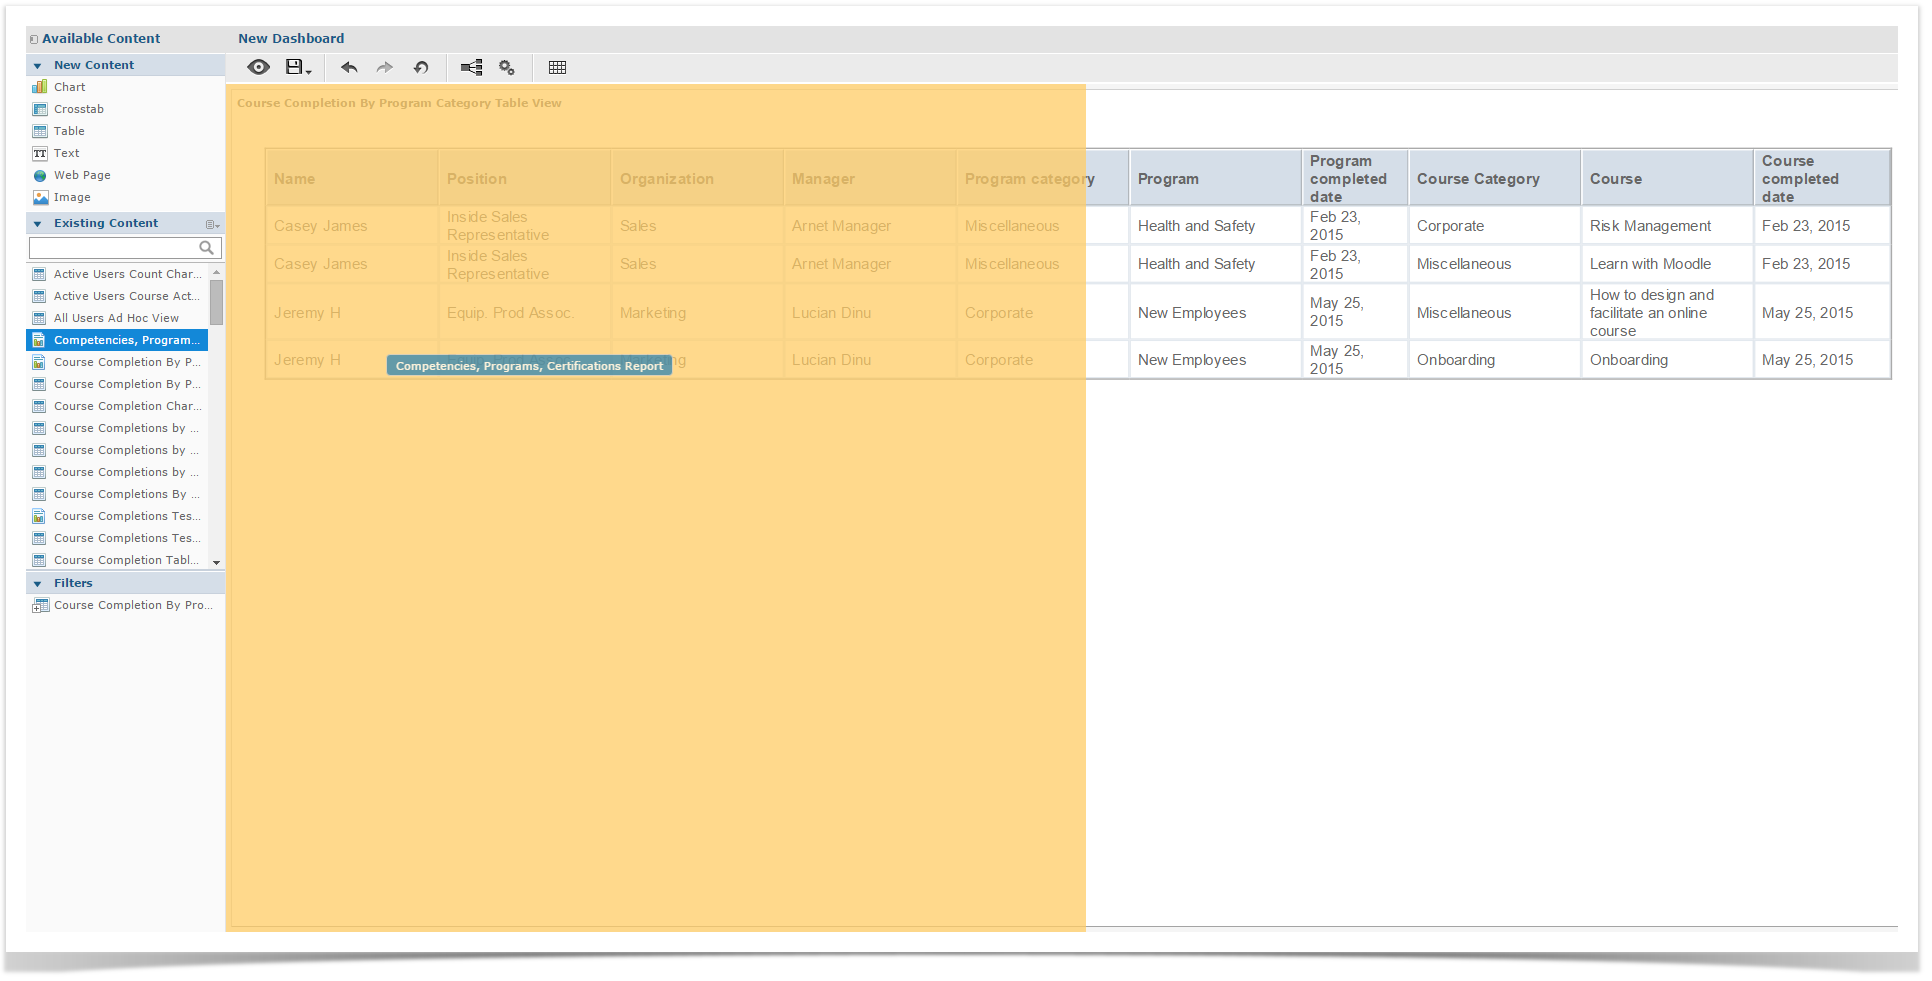
The selected Report appears on the canvas, next to the previous Report. Both Report Dashlets are sized to fit side-by-side on the canvas.
In the Dashboard Designer toolbar, click the Properties button to open the Dashboard Properties dialog.
Deselect the Show dashlet borders check box and click the OK button.
- Click the Display icon to preview the Dashboard.
The end user view of the Dashboard appears.
Click to return to the designer
Hover over the Save As icon and then select Save Dashboard.
In the Save As window, change the default name and locate a folder, such as the "/Dashboards" folder.
Click Save.