| Name
|
Size
|
Creator |
Creation Date
|
Last Modification Date
|
Labels |
Attached To |
|
PNG File Chart Format.png |
3.62 MB |
Stewart Rogers |
May 14, 2020 20:32 |
May 14, 2020 20:32 |
|
Page: Case Study: Adding Data Security to Show the Direct Reports of the Direct Reports
|
|
PNG File Bar.png |
2.52 MB |
Stewart Rogers |
May 14, 2020 20:32 |
May 14, 2020 20:32 |
|
Page: Case Study: Adding Data Security to Show the Direct Reports of the Direct Reports
|
|
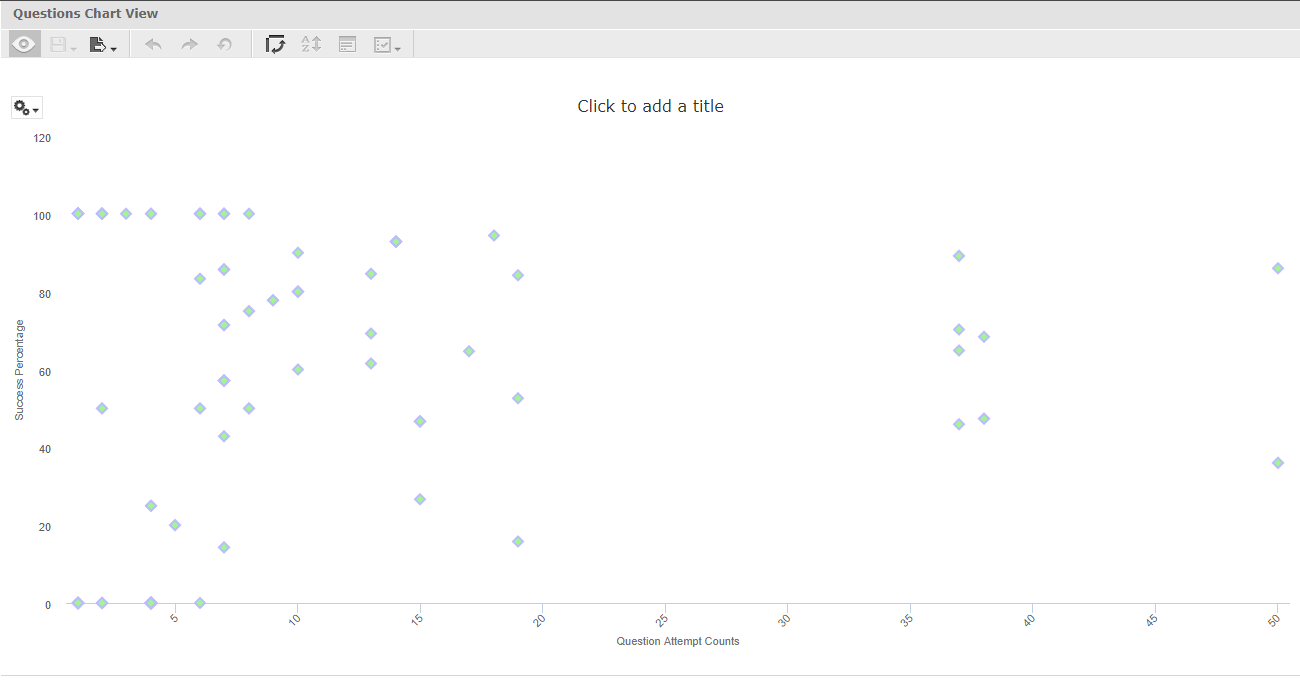
PNG File scatter.png |
2.59 MB |
Stewart Rogers |
May 14, 2020 20:32 |
May 14, 2020 20:32 |
|
Page: Case Study: Adding Data Security to Show the Direct Reports of the Direct Reports
|
|
PNG File pie.png |
2.56 MB |
Stewart Rogers |
May 14, 2020 20:32 |
May 14, 2020 20:32 |
|
Page: Case Study: Adding Data Security to Show the Direct Reports of the Direct Reports
|
|
PNG File area.png |
2.59 MB |
Stewart Rogers |
May 14, 2020 20:32 |
May 14, 2020 20:32 |
|
Page: Case Study: Adding Data Security to Show the Direct Reports of the Direct Reports
|
|
PNG File event_scheduler.png |
3.94 MB |
Stewart Rogers |
Oct 02, 2019 18:29 |
Oct 02, 2019 18:29 |
|
Page: 7.1.0.20
|
|
PNG File manager.png |
1.77 MB |
Stewart Rogers |
Oct 02, 2019 18:23 |
Oct 02, 2019 18:23 |
|
Page: 7.1.0.20
|
|
PNG File Screen Shot 2019-09-23 at 4.46.10 PM.png |
25 kB |
Pavel Boiko |
Sep 23, 2019 23:53 |
Sep 23, 2019 23:53 |
|
Page: Creating the Course Categories Input Control
|
|
PNG File image2019-9-23_16-51-48.png |
25 kB |
Pavel Boiko |
Sep 23, 2019 23:51 |
Sep 23, 2019 23:51 |
|
Page: Creating the Course Categories Input Control
|
|
PNG File image2019-9-23_16-47-45.png |
25 kB |
Pavel Boiko |
Sep 23, 2019 23:47 |
Sep 23, 2019 23:47 |
|
Page: Creating the Cascading Courses Input Control
|
|
PNG File manager.png |
1.77 MB |
Stewart Rogers |
Sep 13, 2019 22:15 |
Sep 13, 2019 22:15 |
|
Page: 7.1.0.19
|
|
PNG File 2019-09-11_133844.png |
3.62 MB |
Stewart Rogers |
Sep 11, 2019 20:39 |
Sep 11, 2019 20:39 |
|
Page: 7.1.0.18
|
|
PNG File area.png |
2.59 MB |
Stewart Rogers |
Aug 16, 2019 16:59 |
Aug 16, 2019 16:59 |
|
Page: Case Study: Chart Styling for Bar, Column, Pie, Scatter, Line and Area Charts
|
|
PNG File pie.png |
2.56 MB |
Stewart Rogers |
Aug 16, 2019 16:53 |
Aug 16, 2019 16:53 |
|
Page: Case Study: Chart Styling for Bar, Column, Pie, Scatter, Line and Area Charts
|
|
PNG File scatter.png |
2.59 MB |
Stewart Rogers |
Aug 16, 2019 16:48 |
Aug 16, 2019 16:48 |
|
Page: Case Study: Chart Styling for Bar, Column, Pie, Scatter, Line and Area Charts
|
|
PNG File Bar.png |
2.52 MB |
Stewart Rogers |
Aug 16, 2019 16:43 |
Aug 16, 2019 16:43 |
|
Page: Case Study: Chart Styling for Bar, Column, Pie, Scatter, Line and Area Charts
|
|
PNG File Chart Format.png |
3.62 MB |
Stewart Rogers |
Aug 16, 2019 16:39 |
Aug 16, 2019 16:39 |
|
Page: Case Study: Chart Styling for Bar, Column, Pie, Scatter, Line and Area Charts
|
|
PNG File Zoola Analytics Report Block Scheduler.png |
3.62 MB |
Stewart Rogers |
Jul 03, 2019 21:23 |
Jul 03, 2019 21:23 |
|
Page: 7.1.0.17
|
|
PNG File logout.png |
329 kB |
Stewart Rogers |
Jul 03, 2019 21:16 |
Jul 03, 2019 21:16 |
|
Page: 7.1.0.17
|
|
PNG File logout.png |
329 kB |
Stewart Rogers |
Jun 20, 2019 17:04 |
Jun 20, 2019 17:04 |
|
Page: 7.1.0.16
|